Sign inGet started

WhatsApp metrics

The Metrics page in the Bird dashboard shows how your WhatsApp channel is doing: how much of it reached the recipient's device, whether your failure rate is drifting, and how fast it all moved. This guide walks through that page, what each number means, and when to act on it.
Metrics are the aggregate view across everything your workspace sends. For the lifecycle of a single message (did this number receive it, and when), see the WhatsApp log and events.

Read your metrics

The Metrics page lives at WhatsApp → Metrics in the Bird dashboard; it is visible to workspace members who hold both the WhatsApp read and Analytics read permissions. Every number respects the range picker (last 24 hours, 7, 30, or 90 days) and updates as new events arrive, so a report you open now reflects sends and delivery receipts up to seconds ago.
Rates use each message's send time. A delivery receipt that arrives today for a message accepted yesterday counts toward yesterday, alongside that message's own accepted. Each range therefore describes the messages you sent in it, start to finish. That also means the most recent hours under-report delivered while receipts are still arriving, and their numbers grow as those receipts land. accepted is the denominator for both rate cards; it's the count of messages we admitted in the range, and every rate is measured against it.
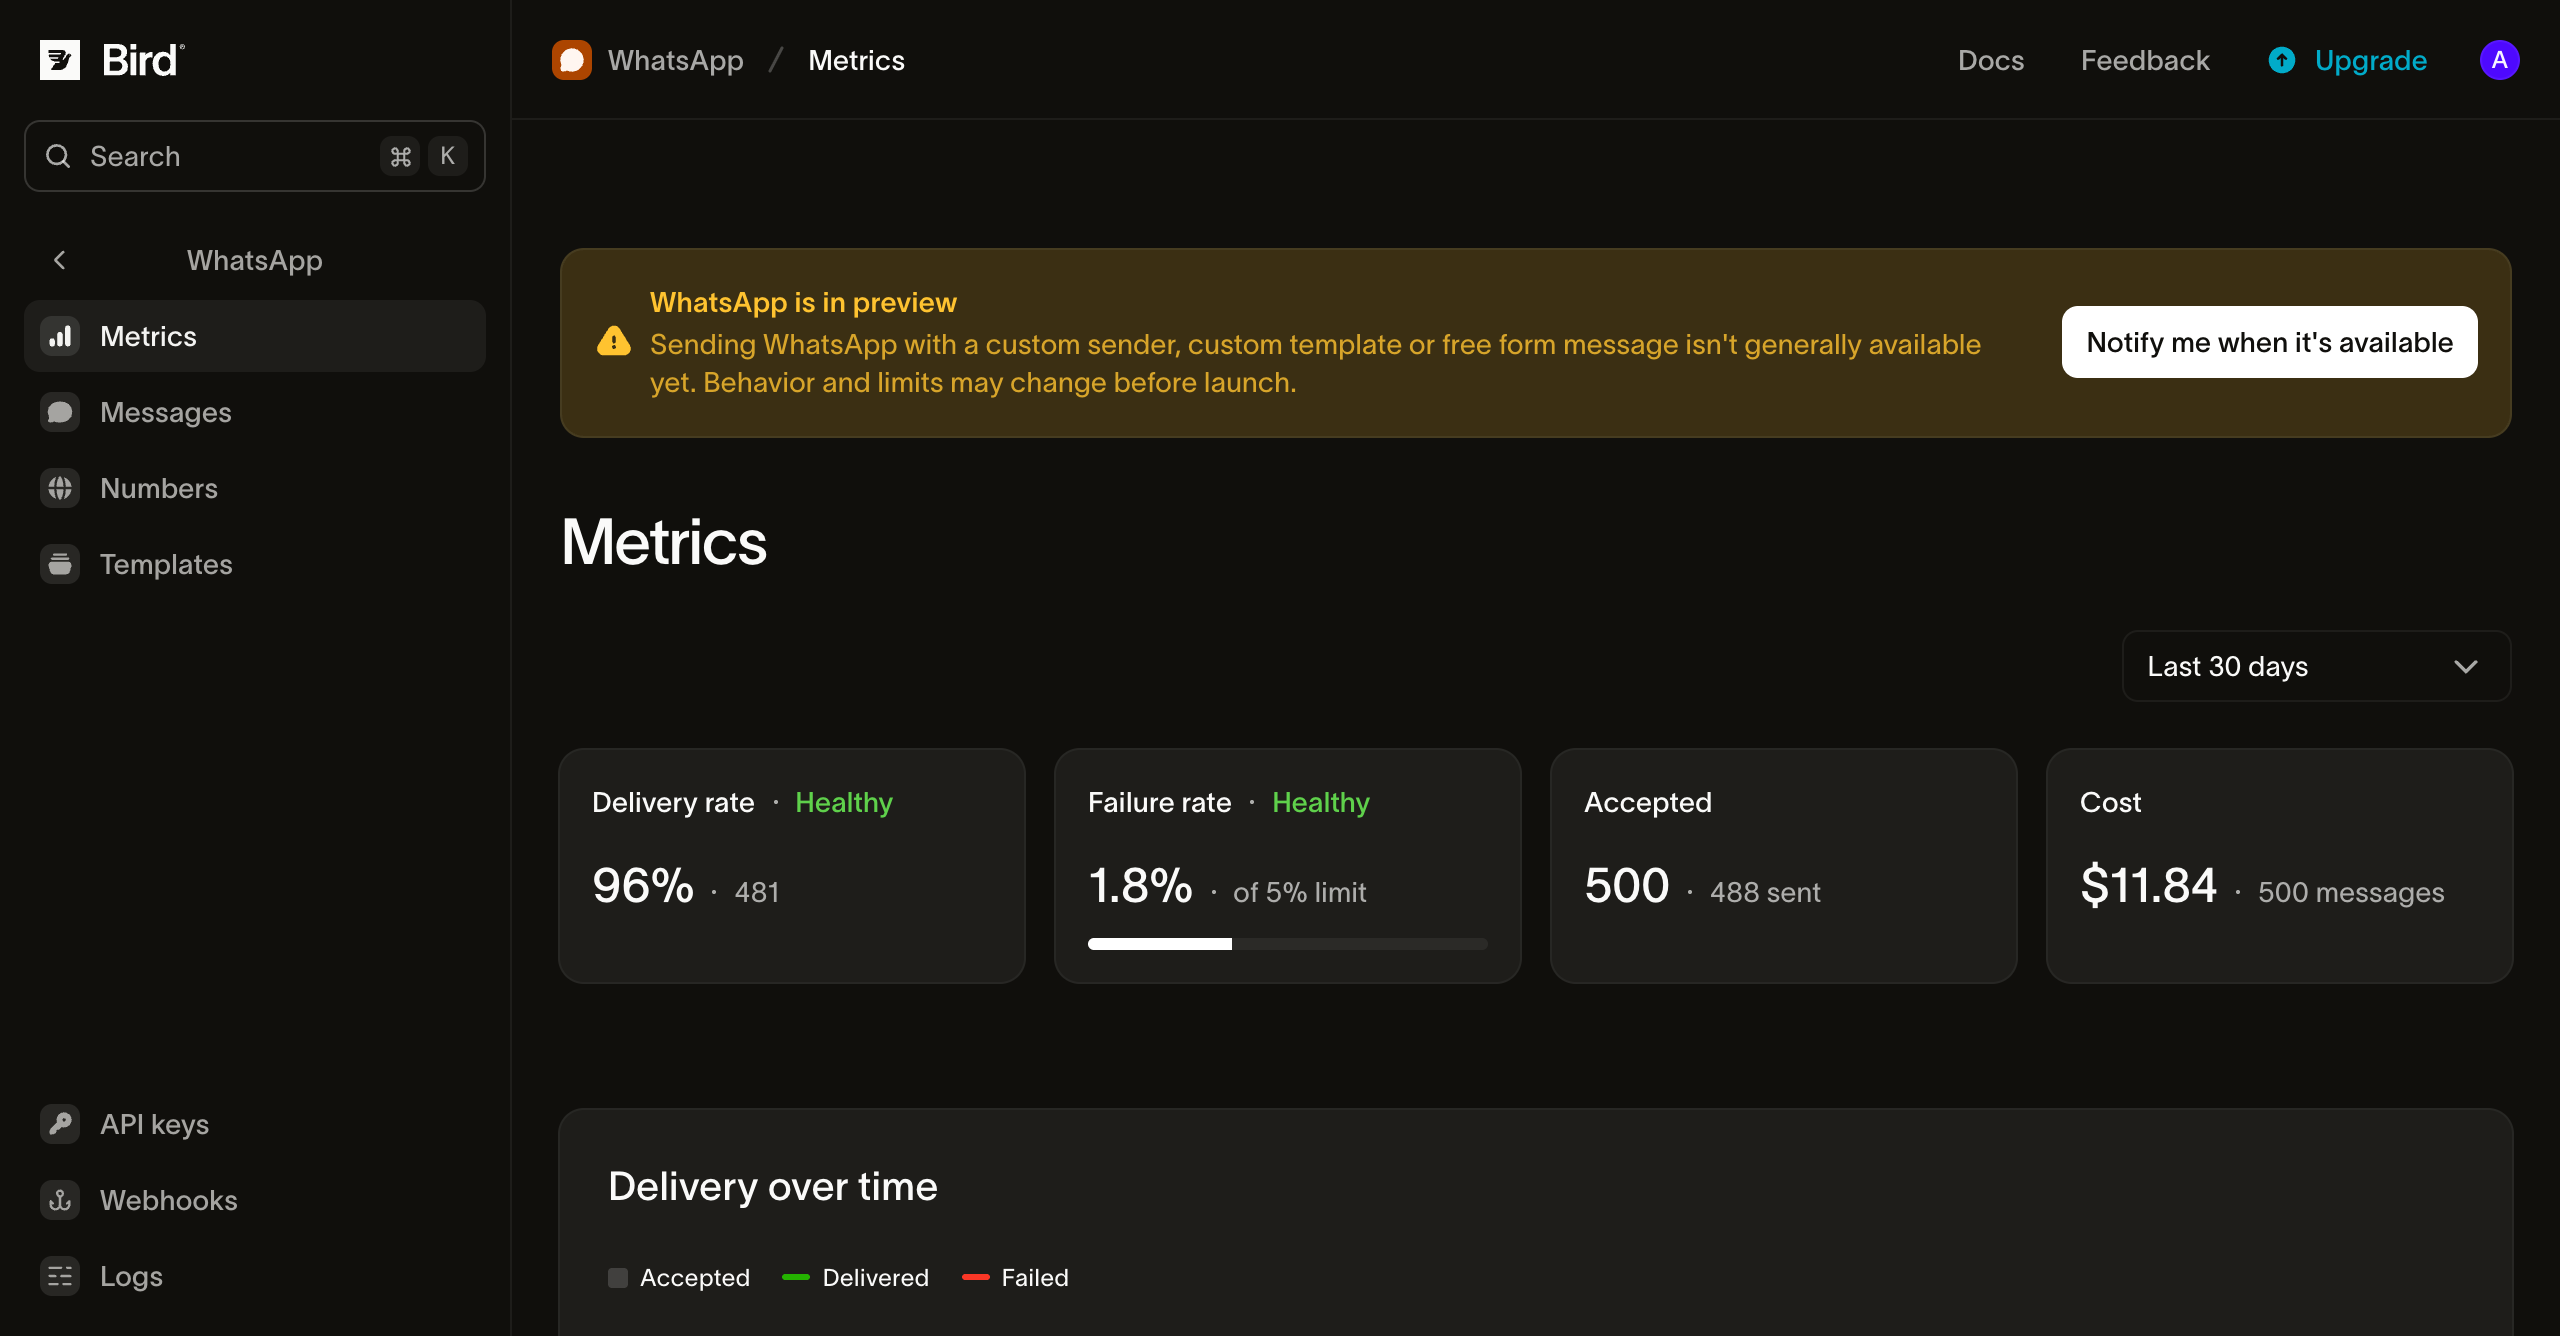
The WhatsApp Metrics page in the Bird dashboard: the delivery-rate, failure-rate, and accepted-volume summary tiles above the delivery-over-time chart

The summary tiles

The row of tiles at the top is your at-a-glance health check:
  • Delivery rate: delivered messages as a share of accepted. The tile reads Healthy above 95%. At or below that, something is failing to reach devices: invalid numbers, an expired care window, or a template problem. The failure-cause histogram (see Failure rate and its causes) tells you which.
  • Failure rate: the share of accepted messages that ended failed. The tile shows your rate against a 5% limit with a progress bar; reaching it flips the tile to Risk. A sustained high failure rate usually points at list quality, an expired customer service window, or a Meta rate limit.
  • Accepted: the raw count of messages accepted in the range, with the number handed on to the WhatsApp network (sent).
The 95% and 5% thresholds are the guardrails we use to color the tiles. They're deliberately conservative; a tile can read Healthy and still have room to improve.

Delivery over time

The delivery chart plots accepted, delivered, and failed volume across the range so you can spot trends and one-off spikes: a bad campaign, a number-list import gone wrong, a template that started getting rejected. The bucket size follows the range (hourly for 24 hours, daily for longer windows).

Failure rate and its causes

Below the delivery chart on the Metrics page, a failure-rate line plots the per-bucket failure rate across the range, while the Failure rate summary tile holds the whole-window figure. A histogram breaks failures down by normalized error code, ranked by count with each code's share of failed messages. WhatsApp's failure reasons are an open set, so the histogram lists whichever codes actually occurred in the range rather than a fixed list; a rising bar on one code points you straight at the fix.

Delivery latency

The latency table reports two stages at the p50, p95, and p99 percentiles:
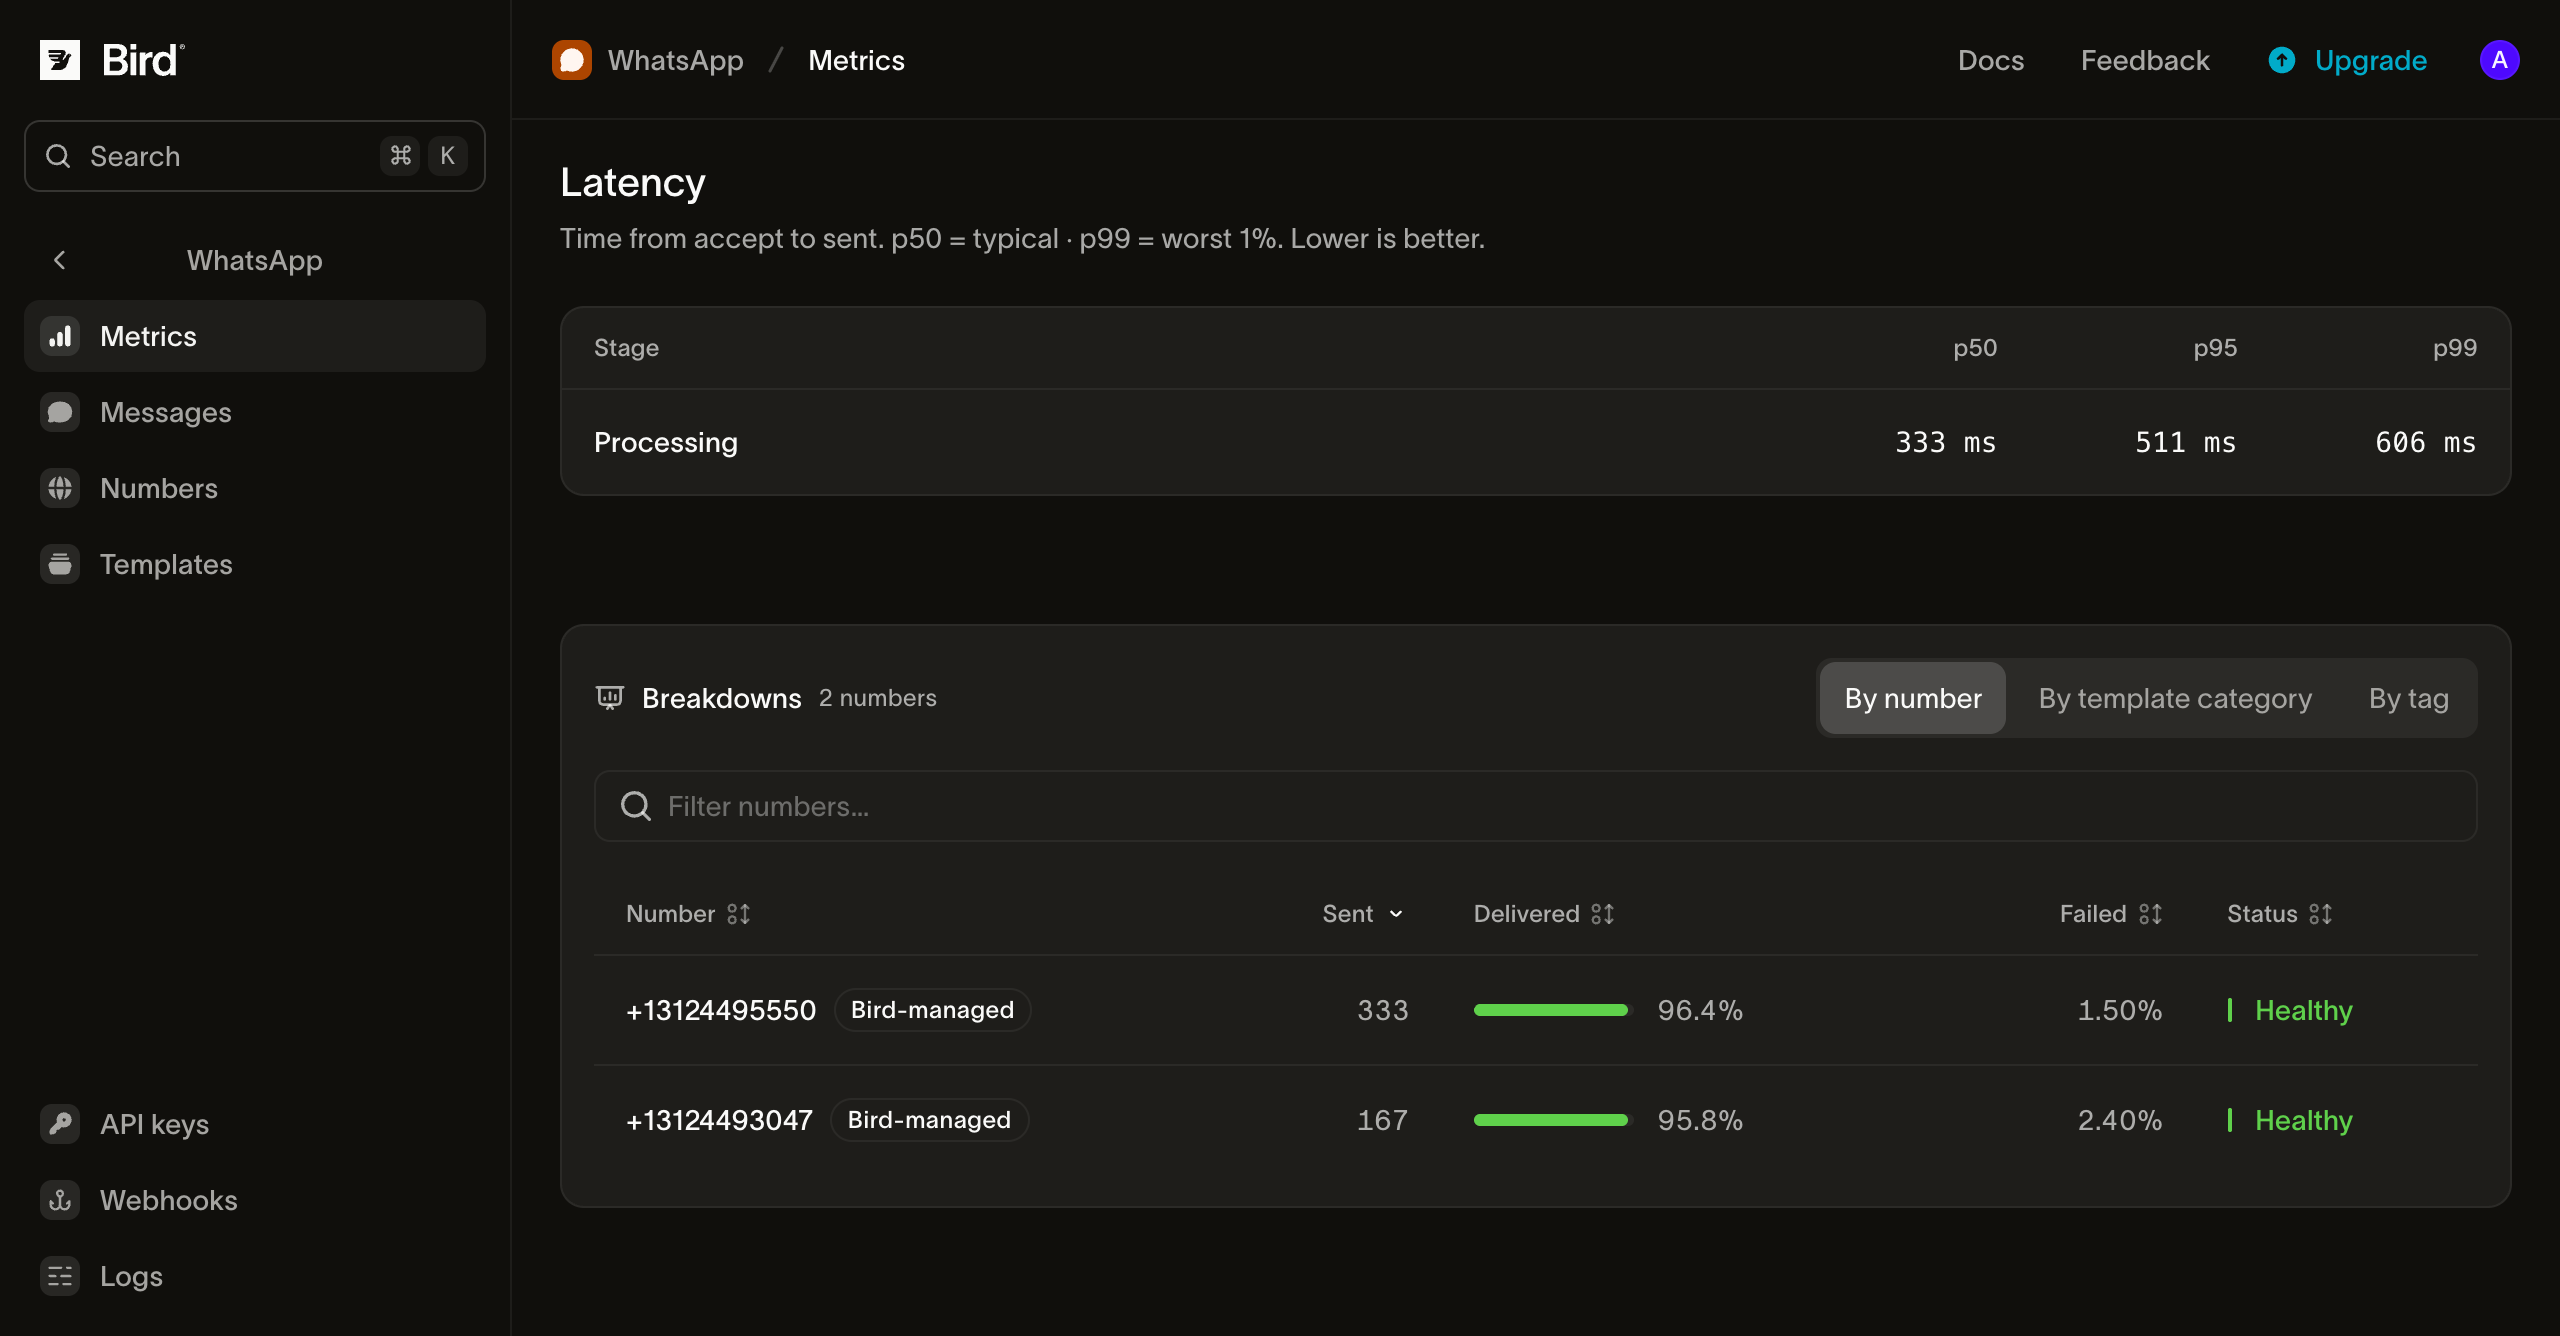
  • Processing: from accepting a message until we hand it to the WhatsApp network. This stage is entirely our own pipeline, so a slow percentile here points at us.
  • Total: end to end, from accepting the message until WhatsApp confirms delivery to the recipient's device. The gap between Total and Processing is the WhatsApp network and the recipient's device, which we don't control. A phone that is offline for an hour stretches Total while leaving Processing unchanged.
Use p95/p99 to catch the slow tail: a healthy median with a slow p99 usually points at one template or destination lagging. Latency is a whole-window figure; a stage or percentile with no data for the range shows a placeholder.

Breakdowns

The Breakdowns panel slices the same delivery numbers so you can isolate a problem to its source:
  • By number: each sending business number's accepted, delivered, and failed volume with its delivery rate, so you can compare senders side by side.
  • By template: the same split per template, to find the one template dragging a rate down.
  • By template category: the same split across Meta's template categories, the cut that also drives your spend.
  • By tag: the tags you attach to a send, the most flexible cut: tag a campaign, template, or experiment variant and compare them directly.
  • By country: the same split per destination country, to see whether a delivery problem follows a market rather than a sender or a template. A recipient whose country cannot be worked out (a number that looks like a phone number but belongs to no country, or an international range like freephone) is counted under ZZ, the same placeholder the SMS country breakdown uses. Sends to a group are the one thing left out, because a group can span several countries at once and no single destination describes it, so this tab adds up to the totals above it minus your group sends. Sends from before the tab shipped are also thin: only recipients WhatsApp had already identified were filled in, so a range reaching back before then under-reports every country until that older traffic ages out after 30 days.
Each row also gets a derived status (Healthy, Watching, or Throttled) driven by its own delivery and failure rates, so a struggling number or category stands out without you reading every column. Each tab ranks the top rows for the range; when a dimension has more distinct values than fit, the panel notes "Top N of M".
The lower half of the WhatsApp Metrics page in the Bird dashboard: the delivery-latency table (processing p50/p95/p99) above the Breakdowns panel, with delivery broken down by number, template, template category, and tag

Programmatic access

The aggregates behind this page are also a public API. Typed methods ship in the TypeScript, Python, PHP, and Go SDKs under bird.whatsapp.stats, the bird CLI exposes them as bird whatsapp stats <verb>, and an agent reaches them through the whatsapp_stats_* MCP tools. Full request and response schemas are in the API reference.

The aggregate and the time series

GET /v1/whatsapp/stats/summary returns one aggregate row for the window: lifecycle counts (accepted, sent, delivered, failed, rejected) with delivery and failure rates, engagement (read, read_rate), and latency percentiles (p50, p95, p99) for three stages: processing, delivery, and total. /daily and /hourly return the same lifecycle and read counts one row per calendar day or hour, each with its own latency percentiles; only the rates (delivery_rate, failure_rate, read_rate) are whole-window figures, read those from /summary. All three accept one dimension filter at a time: template, category, tag, or phone_number. Here, phone_number restricts to a single business sender, in E.164 form, not the contact it filters by on the deprecated phone_number param of GET /v1/whatsapp/messages.

Choosing the window

from and to accept a calendar day or an RFC 3339 instant, but which forms an endpoint takes differs:
EndpointBoundsMaximum window
/summaryBoth calendar days, or both RFC 3339 instants365 days, or 720 hours on instants
/dailyCalendar days only365 days
/hourlyRFC 3339 instants only720 hours (30 days)
On /summary, mixing a day bound with an instant bound returns 422. Instant bounds round down to the hour on /summary and /hourly, the only two that accept them. Set timezone to an IANA identifier to compute day and hour boundaries locally instead of in UTC; once it's set, a numeric UTC offset such as +05:45 in an instant bound is rejected. Add compare=previous_period to /summary for the preceding equal-length window and the change against it.

Breakdowns

Six endpoints rank the same delivery numbers by one dimension, each already single-dimension so none takes a filter: by number, by template, by template category, by tag, and by error code (failed messages only, grouped by normalized failure reason). Rows rank by accepted volume (failure count on error codes) and cap at limit (default 50, maximum 200). A breakdown's rows sum to less than the window's accepted total whenever a send carries no value for that dimension: a free-form send resolves no template, and an untagged send no tag. Compare a breakdown against itself over time rather than against /summary. Every row but an error-code row also carries its own latency percentiles. A sixth, by country, groups the same numbers by the recipient's destination market; a recipient whose country cannot be resolved counts under ZZ, and group sends are absent because one send can span several countries.

Received messages

Four endpoints under /v1/whatsapp/stats/inbound/ cover what your numbers received rather than sent: summary, daily, hourly, and by phone number. Each row carries only a received count; a received message has no delivery lifecycle to break down further. These are nested under bird.whatsapp.stats.inbound in the SDKs and bird whatsapp stats inbound <verb> in the CLI.

Per-message reconciliation

The stats endpoints answer aggregate questions; they don't replace per-message lookups. To confirm what happened to one message, consume webhook events as they happen, or page through GET /v1/whatsapp/messages and each message's events endpoint, whose filters (status, recipient, tag, time window) cover most reconciliation jobs.

Next steps