SMS metrics
The Metrics page in the Bird dashboard shows how much SMS traffic reached handsets and how your failure rate changes. This guide explains each value and when to investigate it.
Metrics are the aggregate view across everything your workspace sends. Counts use approximate distinct-message aggregation, so use message and billing records when exact reconciliation is required. For the lifecycle of a single message (did this number receive it), see the SMS log and events.
Read your metrics
Open SMS > Metrics in the dashboard. The range picker offers the last 24 hours or 7, 30, or 90 days. Values update as sends and delivery receipts arrive.
Rates use each message's send time. A delivery receipt that arrives today for a message accepted yesterday counts toward yesterday, alongside that message's own accepted. Each range therefore describes the messages you sent in it, start to finish. accepted is the denominator for both rate cards; it's the count of messages we admitted in the range, and every rate is measured against it.
A range that includes recent sends can temporarily under-report delivered while receipts are still arriving. The count settles as those messages finish.
The summary tiles
The row of tiles at the top is your at-a-glance health check:
- Delivery rate: delivered messages as a share of accepted. It reads Healthy above 95%; at or below that, something is failing to reach handsets (bad numbers, blocked content, or routing problems) and the failure breakdown tells you which. The tile also shows the change versus the previous period.
- Failure rate: the share of accepted messages that ended
undelivered,failed, orexpired. The tile shows your rate against a 5% limit with a progress bar; reaching it flips the tile to Risk. A sustained high failure rate usually means list-quality or content problems. - Accepted: the raw count of messages accepted in the range, with the number handed on to carriers (
sent) and the change versus the previous period.
The dashboard uses the 95% and 5% thresholds for its Healthy and Risk labels. A Healthy label does not mean every message was delivered.
Delivery over time
The delivery chart plots accepted, delivered, and failed volume across the range so you can spot trends and one-off spikes: a bad campaign, a number-list import gone wrong, a route that degraded. The failed series here rolls up every non-delivery outcome (undelivered, failed, and expired) into one line. The bucket size follows the range (hourly for 24 hours, daily for longer windows).
Failure rate and its causes
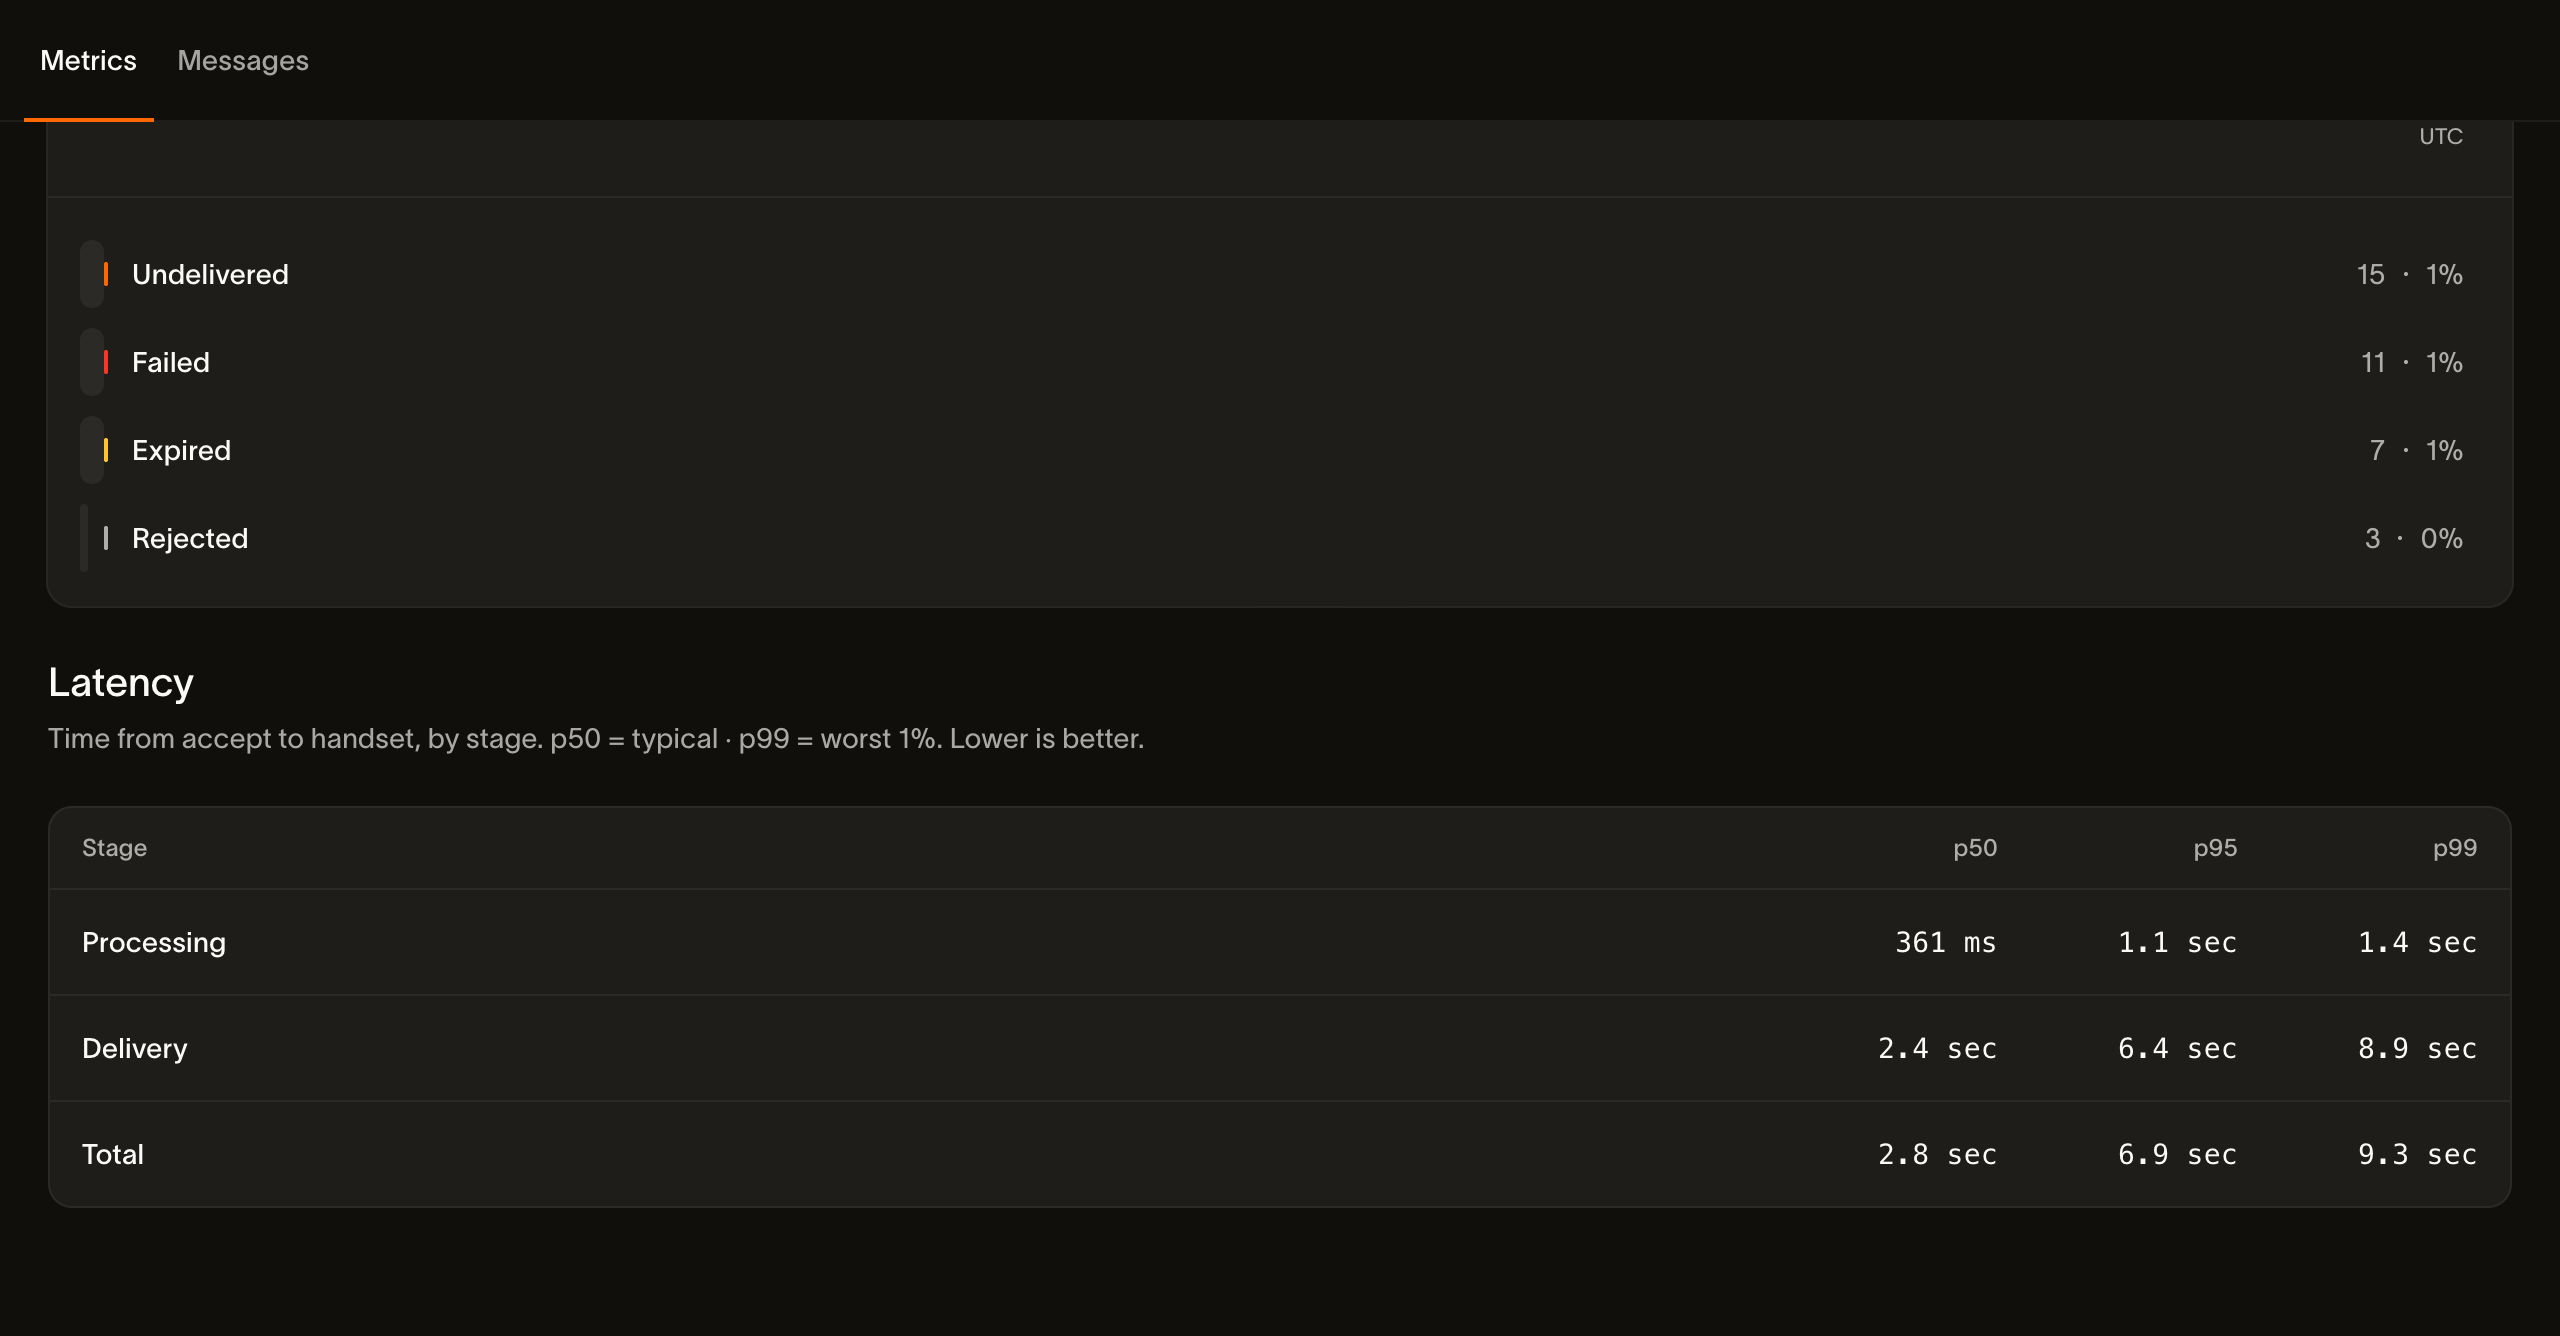
The Metrics page also plots the per-bucket failure rate and groups non-deliveries by cause in an outcome histogram:
- Undelivered: a non-permanent non-delivery. The handset was off or unreachable.
- Failed: a permanent failure; the message cannot be delivered.
- Expired: the carrier stopped trying and reported the message as expired. Bird sets no validity window of its own.
- Rejected: the message was refused (a policy check, a failed charge, or a carrier that turned it away) rather than attempted and lost.
Each bucket shows its count, and all but rejected show their share of accepted messages. When reconciling the numbers: the Failure rate tile counts undelivered, failed, and expired, while rejected is shown in this histogram but sits outside the failure-rate math. A rejected message was refused rather than lost in delivery, so it's tracked separately from delivery failures.
Delivery latency
The latency table splits timing into Processing, Delivery, and Total. Processing runs from acceptance to carrier handoff; Delivery runs from handoff to the reported delivery outcome; Total spans acceptance to that outcome. Each stage includes p50, p95, and p99 percentiles. Use p95 and p99 to identify a slow carrier or destination. Latency covers the full window, and a percentile without data shows a dash.
Programmatic access
The stats API exposes the same summary, series, and breakdowns as the dashboard. Breakdowns cover country, carrier, originator, category, status, error code, and inbound messages. Values match the dashboard for the same range.
For per-message reconciliation rather than aggregates, consume webhook events as they happen, or page through GET /v1/sms/messages.
Next steps
Use SMS analytics to connect delivery reporting with the wider campaign or application workflow.
- Stats API: retrieve every value on this page from code.
- SMS log: inspect the messages behind the aggregates.
- Events: consume the events behind the metrics.
- Sending SMS: review categories, tags, segments, and spend.
Related resources
Continue with the documentation, guides and examples for this topic.